Reforming Accounting to Fix Hidden Losses in the Circular Flow of Income

The global economy is plagued by systemic inefficiencies rooted in the circular flow of income (CFI), a foundational model in economics that describes the reciprocal movement of money between households, businesses, governments, and financial institutions. These inefficiencies manifest as unrecovered losses, draining resources from productive enterprises. To rectify this, we must reclaim these dissipated assets and redirect them toward businesses, fostering sustainable growth.

Achieving such reform demands a fundamental overhaul of prevailing accounting standards. Current practices fail to differentiate between gross domestic product (GDP) measured over time—representing cumulative gains—and GDP at any instantaneous point, which often conceals latent losses. This oversight constitutes a form of accounting malpractice, as demonstrated by empirical analyses such as the Test for Split Velocity. Even leading international accounting, auditing, and advisory firms perpetuate this error, providing misguided counsel to stakeholders. The repercussions are far-reaching, influencing corporate operations, government fiscal policies, parliamentary oversight of public finances, central bank monetary strategies, and stock exchange governance.

The economic toll is substantial, perpetuating inflation, instability, and suboptimal resource allocation. To illustrate, consider a relatable example accessible to non-specialists: the 2022 financial performance of First Quantum Minerals (FQM), a major mining company.

In 2022, FQM reported a net profit of $1.034 billion on total revenue of $7.626 billion, with implied total costs of approximately $6.592 billion. Under conventional accounting, this is interpreted as profit equaling total revenue minus total costs over the fiscal period: $7.626 billion – $6.592 billion = $1.034 billion. However, this temporal aggregation overlooks instantaneous dynamics. At any given moment, FQM effectively forfeits an amount equivalent to its total revenue to the CFI’s inefficiencies—resources that leak out without recirculation. Thus, the $7.626 billion in revenue generated over time is offset by an equivalent hidden loss at each point, yielding zero net growth ($7.626 billion – $7.626 billion = $0).

Businesses cannot thrive in a zero-growth paradigm. To compensate, FQM and similar entities resort to cost-plus pricing—marking up products beyond production costs—to artificially inflate money supply by $1.034 billion. This practice stems from the same accounting blind spot, which leaves central banks oblivious to the need for targeted interventions to neutralize point-in-time losses. The result is entrenched inflation and broader economic volatility. Our innovation, the Split Velocity system, is engineered to mitigate this precise issue.

Split Velocity operates instantaneously to recapture CFI losses, restoring them to the enterprise. For FQM in 2022, this would have reclaimed the $7.626 billion dissipated to the flawed CFI, effectively yielding $7.626 billion in recoverable earnings. While technically distinct from traditional profit, these restored funds are functionally equivalent. Due to accounting oversights, however, FQM unwittingly forfeited approximately $6.592 billion in potential earnings.

The implications for stakeholders are stark. FQM’s earnings per share stood at roughly $1.50 (based on 692.5 million shares outstanding). With Split Velocity’s recovery mechanism, this could have risen to $11.04 per share, representing a per-share loss of $9.54 attributable to accounting negligence—a collective shortfall of $6.592 billion for shareholders.

This simplified case underscores a pervasive global phenomenon: every business suffers analogous losses, depriving societies of vital resources. The CFI must not be permitted to erode value unchecked. Our commitment is to drive systemic change, advocate for accounting reforms, and position Split Velocity as the catalyst for accelerated, baseline economic growth worldwide.

(*It’s also worth noting that FQM spent $5.38B on Capital [equipment, machinery, taxes, repaying loans, electricity etc] in 2022 which is $2.246B less than it could have invested with Split Velocity, which would have been able to free up 100% of Total Revenue ($7.626B) for Capital expenses by recovering resources being wasted by the CFI, which would have allowed for an increase in FQM’s overall mining output.)

Split Velocity is proprietary © 2025 All Rights Reserved

All the information on Split Velocity, including this, is copied, reproduced or derived from the book:

The Greater Poverty & Wealth of Nations, 2010 Siize Punabantu

Go through and take the Empirical and Legally Admissible Test for Split Velocity here:

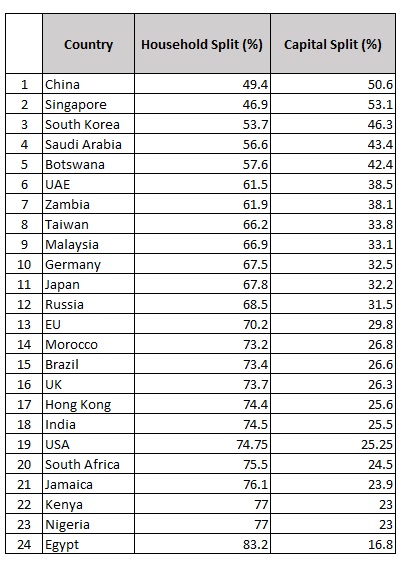
Run the test to see how it affects a national economy (sample of 24 countries) here:

https://collision-drive.blogspot.com/p/split-velocity-test-v9.html

Go through a Post Test Analysis for the EU here:

Mirror, Mirror on the Wall….which is the Greatest Country of Them All?

A much needed reality check.

The Split Velocity Test of a sample of 24 countries.

It tells us something that we have known for some time now, but have not had the metric to point at. Your wellbeing is much greater living in some “poor developing countries” like Zambia and Botswana than when you are living in what are considered “better off” or the wealthiest and most developed countries in the world.

When consumption by households has grown disproportionately to the extent that it places tremendous pressure on capital the competition for resources in a given population between individuals and groups begins to move toward intolerance, hegemony, crime, underhandedness, and inevitably hate. There develops a “who is eating my lunch” mentality that, like water finds a crack through which to leak its contents and will emerge in all kinds of negative behaviour depending on the prevailing divisions and weaknesses in an economy. If the cracks are between foreigners and locals, xenophobia will begin to agitate within a country, if its between rich and poor social groups may riot against their own elected government, if its between racial groups racism will begin to stoke divisions, if there are no clear divides the cracks may begin to appear within groups in unexpected ways. Often the animosity between human beings may seem to have no source or may seem inhumane, bordering on insanity, however, the split, being consumption heavy, is placing any given population under duress leading to a high potential for internal mental strife and social conflict due to the competition for scarce resources being unnaturally high. This problem remains difficult to see or explain without a Split Velocity test.

Resourcism and a “Who’s Eating My Lunch Mentality”

Split Velocity requires countries to aim for a 50:50 balanced or “ying and yang” like split between Households and Capital, or to where the split is heavier on the Capital side in order for the availability of resources in an economy to adequately satisfy a population. However, an emphasis is placed on balance since a situation where Capital overwhelms Households can also have negative socio-economic effects on a population.

The book the Greater Poverty & Wealth of Nations [ Siize Punabantu], introduces the term “resourcism”. Resourcsim refers to how individuals and groups of any kind position themselves to attract and gain resources of any kind which they feel are necessary and important for the type of life or lives they want to have.

The 24 countries surveyed indicate where a person or group’s sense of well-being and happiness is higher. When the Household metric becomes too high against investment in Capital it means too many people are competing for proportionally smaller availability of wealth and resources be it money, food, health, housing, hospitals, clinics, jobs and so on. The undercapitlised economy is unable to offer these in sufficient quantities. These economies whether rich or poor, developed or developing are classified as being in a constant and persistent state of distress, its like the population being inside an invisible socio-economic pressure cooker. The behavior of their populations will begin to reflect this distress wherever socio-economic cracks may exist creating some kind of general unease, disregard for laws and rules as survival instinct takes precedence or it may grow into outright open confrontation between people and groups.

Transformation

Though countries with a disproportionately large Household or consumption split against Capital may be gravely disadvantaged they offer the greatest hope. This is because they also have the opportunity to experience the greatest shift to higher living standards and the greatest increase in wellness, happiness and general socio-economic wellbeing when Split Velocity is used to re-balance their economies by recovering the tremendous amount of resources being wasted by the defective CFI equivalent to GDP.

Split Velocity is a scalar tool that recovers losses in total revenue (TR) being wasted by a poorly designed Circular Flow of Income (CFI). It is able to restore TR to business of any size, be it a corner grocery store or a multinational mining conglomerate. Being a scalar economic tool means it is able to commandeer GDP and moves resources at macroeconomic levels, like earth moving equipment, yet at the same time processes each individual microeconomic input with the necessary dexterity that ensures economies can turn the tables on scarcity, moving from high levels of duress to abundance and prosperity capable of satisfying the needs of any given population.

Leaders who drive the implementation of our Split Velocity model will be responsible for the greatest increase in wealth, wellness and wellbeing in history and will be forever remembered for the transformation they brought to their people and the economy.

The Split Velocity Test: Revealing 100% Inefficiency in the European Union’s Circular Flow of Income and Potential Recovery through SV-Tech – A 2024 Case Study

Author: Siize Gabriel Punabantu
Date: July 16, 2025

Abstract

The Circular Flow of Income (CFI) model illustrates the reciprocal exchange of resources between households and firms. The Split Velocity Test quantifies the allocation of gross domestic product (GDP) between households (labor) and capital (non-human inputs) at a point in time, revealing a structural inefficiency where resources allocated to one factor are unavailable to the other, resulting in a 100% subtraction loss equal to GDP. Using 2024 European Union (EU) GDP data from the IMF and Eurostat, we estimate the split as approximately 70.2% to households and 29.8% to capital, incorporating consumption, investment, government spending, and net exports with detailed breakdowns. This moderately consumption-heavy split supports growth but highlights infrastructure gaps and debt burdens. The inefficiency renders the economy a “zero growth” system. Split Velocity Technology (SV-Tech) can recover 0–100% of these wasted resources, potentially doubling GDP and addressing infrastructure and debt issues in approximately 0.43 years through parallel allocation. The analysis draws on classical economic theory and contemporary data, demonstrating how SV-Tech could enhance economic performance.

Keywords: Circular Flow of Income, Split Velocity Test, GDP Inefficiency, Resource Recovery, SV-Tech

Page 1

Introduction

The Circular Flow of Income (CFI) model, articulated in Adam Smith’s Wealth of Nations (1776), illustrates the exchange of money and resources between households and firms [1]. Households provide labor and receive wages, while firms produce goods and services, generating revenue. However, the CFI overlooks a critical inefficiency: at any point in time, resources allocated to households (e.g., wages) are unavailable to capital (e.g., machinery), and vice versa, creating a “subtraction” effect. The Split Velocity Test quantifies this, demonstrating a 100% inefficiency equal to GDP. Using 2024 EU data, this paper derives the percentage split, highlights consumption-driven growth with infrastructure and debt challenges, quantifies shortfalls, and proposes SV-Tech for recovery, potentially doubling GDP and resolving key issues.

Page 2

The Split Velocity Test

The Split Velocity Test evaluates the CFI by assessing resource allocation between households and capital at a specific moment. It assumes GDP components—consumption (C), investment (I), government spending (G), and net exports (NX)—are spent on either labor (households) or non-human inputs (capital). The methodology involves:

  1. Calculating daily GDP: Annual GDP divided by 365.
  2. Allocating components: C to households, I to capital, G (55% households, 45% capital), NX proportional to C/I.
  3. Computing the split: Households % = (Households allocation / Total) × 100; Capital % = 100 – Households %.
  4. Demonstrating inefficiency: Allocation to one factor is a loss to the other, equaling 100% of GDP.
Page 3

Percentage Split for the EU Using 2024 Data

For 2024, the EU’s nominal GDP was $18.50185 trillion (IMF, Eurostat) [2], [3]. Daily GDP is $50.69 billion.

Component Breakdown:

  • Consumption (C): $9.44099 trillion (51.0%).
  • Investment (I): $4.07038 trillion (22.0%).
  • Government Spending (G): $4.62546 trillion (25.0%).
  • Net Exports (NX): $0.36502 trillion (2.0%).

Table 1: Allocation of 2024 EU GDP Components

Component Annual Households ($T) Annual Capital ($T) Daily Households ($B) Daily Capital ($B)
Consumption (C) 9.44099 0 25.866 0
Investment (I) 0 4.07038 0 11.152
Government Spending (G) 2.544 (55%) 2.08146 (45%) 6.984 5.704
Net Exports (NX) 0.25478 (69.8%) 0.11024 (30.2%) 0.698 0.302
Total 12.23977 6.26208 35.59 15.10

Split: Households 70.2% ($35.59B / $50.69B), Capital 29.8% [2], [3].

Page 4

Implications of the Split: Consumption-Driven Growth with Challenges

The 70.2%/29.8% split indicates a consumption-heavy economy (C, $9.44099T), supporting a population of 450M [4]. Investment (22%) supports moderate growth (1.8% in 2024), but infrastructure gaps ($10T for energy, transport) and high debt (82.3% GDP) signal stress [3], [4]. Inequality (Gini ~0.31) is moderate but persistent [5]. Compared to balanced economies like China (49.4%/50.6%), the EU’s consumption bias limits capital efficiency.

Table 2: EU Infrastructure and Debt Shortfalls

Area Current Status Comparison Implications
Roads and Bridges Aging; gap $3T [4] USA modernized Maintenance costs
Railways Extensive; gap $2T [4] China 25,000 miles Expansion needed
Airports Congested; gap $1T [4] UAE top-ranked Capacity issues
Ports Efficient; gap $0.5T [4] Singapore advanced Trade competitiveness
Energy Grid Transitioning; gap $3T [4] Germany 40% renewables High transition costs
Water Systems Good; gap $0.5T [4] Japan low loss Resilience risks
Broadband/5G Uneven; gap $0.5T [4] South Korea 97% Digital divide
Space Exploration Limited; gap $0.2T [4] USA leading Missed innovation
Jobs/Skills Unemployment 6.5%; gap $1T [6] Singapore 2% Skill mismatches
Debt 82.3% GDP; high [3] Japan 250% GDP Fiscal strain
Page 5

Demonstrating 100% Inefficiency

The CFI’s “subtraction effect” makes resources allocated to households ($12.23977T) unavailable to capital, and vice versa ($6.26208T), nullifying $18.50185T GDP [3]. This creates a “zero growth” system despite reported growth [2].

Page 6

Recovering Wasted Resources with SV-Tech

SV-Tech enhances resource velocity, recovering 0–100% of the $18.50185T loss. At 100% recovery, GDP doubles to $37.0037T; at 60%, it reaches $29.60296T. Parallel allocation of $18.50185T/year resolves all issues in ~0.43 years:

  • Debt ($15.23T): $43.26T/year.
  • Infrastructure ($10.7T): $42.79T/year.
  • Specific gaps (e.g., $3T energy, $0.2T space): $0.47T–$7T/year [4].
Page 7

Doubling EU GDP: 2024 Case Study

Base GDP: $18.50185T. At 100% recovery, $18.50185T is reclaimed, yielding $37.0037T. Simulation: Daily households $35.59B, capital $15.10B; annual losses $6.26208T and $12.23977T, respectively.

Page 8

Conclusion

The Split Velocity Test reveals a 100% CFI inefficiency, with a 70.2%/29.8% split highlighting consumption-driven growth with infrastructure and debt challenges. SV-Tech could double GDP and resolve issues in 0.43 years, enhancing the EU’s economic performance.

Page 9

References

  1. Smith, A. (1776). An Inquiry into the Nature and Causes of the Wealth of Nations. London: W. Strahan and T. Cadell.
  2. IMF. (2024). EU Economic Outlook 2024. https://www.imf.org
  3. Eurostat. (2024). National Accounts 2024. https://ec.europa.eu/eurostat
  4. World Bank. (2024). EU Economic Overview 2024. https://www.worldbank.org
  5. OECD. (2024). Income Inequality in the EU. https://www.oecd.org
  6. World Economic Forum. (2025). Future of Jobs Report. https://www.weforum.org
  7. Punabantu, S. G. (2025). The Greater Poverty and Wealth of Nations. Split Velocity Solutions Ltd.
Page 10

Post Test Analysis

Post Test Analysis

The Split Velocity test reveals that an imbalance between expenditure on Households and Capital moves an economy into distress and has a greater likelihood of inducing a higher gini coefficient. When the capital base is disproportionately smaller than households it means naturally since industry is inadequately financed it supports fewer jobs and business owners or entrepreneurs. This in turn means that dependency of those without adequate income and earnings on those with adequate income and earnings within the population is high. This is true whether an economy is that of a developing or developed country. What does this mean? It means a country can be considered wealthy because it is developed yet its population lives under higher levels of duress due to a high level of competition for scarce resources; be it jobs, food, housing and so on. On the other hand a developing country with a more balanced split, though less wealthy will have a lower geni coefficient and face lower distress due to lower dependency within the population that has a better distribution of resources.

For instance, the US and the EU have robust economies with decent per capita incomes, however, the split shows underfinancing of capital and high levels of household consumption, which leads to higher levels of dependency within the population where competition for scarce resources is high leading to increased levels of distress. This implies that while a higher standard of living is possible, there may tend to be higher levels of stress, intolerance, unhappiness, mental health problems and general malaise. The worst position is being a developing country with a similar split, that is too consumption heavy, this scenario may lead to this kind of country experiencing what might be considered extreme levels of poverty bordering on internal social conflicts between various groups under duress.

Below is a scatter graph of 24 countries at various stages of development ranging from those with a more even balance between Households and Capital, and those with extreme variance toward consumption that is not balanced by industrial activity.

Countries where the split is high may appear at a greater disadvantage, however, governments that implement Split Velocity here are likely to experience a more profound socio-economic transformation

Interestingly Zambia scores quite high in the group. What the splits reveal is that though Zambia is considered a poor developing country, the income dependency and levels of competition for scarce resources is not as high, which means though you may be more comfortable materially and enjoy a higher standard of living in countries below Zambia, in the list further down, you are likely to experience less stress and therefore greater wellbeing or sense of happiness living in Zambia than any country in the list below it.

End of Brief

Countering Illusive Growth & Development in Africa

We have all heard the accolades about Africa’s mineral wealth, about how no other continent is well endowed with highly sought after precious minerals. However, the subject of growth with development is somewhat devious and dubious in the sense that most scholars (even in the developed world) don’t genuinely understand how to attain it. If they did poverty would be something we read in the history books.

If you read my last post on international trade I explain how the current international trade system needs to be replaced by an Electronic Clearing House (ECH) system. The introduction of this system would net approximately $20.9 trillion per annum easily making it the largest business or commercial entity in the world, 135 times larger than Saudi Aramco, with a spending capacity or budget bigger than that of the United States and China combined. Technically, it is not very difficult to establish an ECH with which to begin to earn this $20.9 trillion, however, it does require cooperation between governments and their central banks. Nevertheless, what can be raised from an ECH is small in comparison to what a Split Velocity model can generate.

The truth is that any approach to economic development and the eradication of poverty that does not address the poor design of the circular flow of income and that does not recover the annual losses it generates that are equivalent to GDP per annum, will inevitably fail. It does not matter how hopeful, country-wide or clever the national strategy or development plan may seem, it is unlikely to succeed in the long run. In Zambia, after independence we saw an earnest effort to channel funds from copper into strategic geographically positioned industries .e.g. batteries in Mansa, glass in Kapiri, pineapple canaries in Mwinilunga, automotive assemblies in Ndola, and so on imagining that an unstoppable march to industrialization had begun. New hospitals and schools were built in nearly every district. However, these industries and this development effort though gallant, well thought out and planned did not have the outcomes anticipated. Many of these industries eventually became derelict and buildings fell to ruin. It does not matter whether today the pineapples are tomatoes or instead of Land Rovers and Fiats African countries are building EVs, the effort remains gallant but as Africans we can no longer allow ourselves to be delusional and deceived by a lack of understanding of the shortcomings of the WKP and economic strategies that will never bear genuine fruit in Africa were economies are smaller, where strategies ignore the faulty design of the CFI, and unseen losses equivalent to GDP per annum that can and will ultimately and relentlessly grind any economic development plan to dust. We must hold onto the strong will to transform the lives of our people but we can no longer afford to keep making the same mistakes over and over again. We can no longer continue to play checkers while those we deal with are playing chess.

We live in times were the process of development planning does not understand a strategy that instructs a country to sell its mineral wealth in exchange for its domestic currency, e.g. sell copper and demand it be paid for in Kwacha. The simple mind thinks: We need forex, so why should we demand our gold, diamonds, copper, cobalt, oil, and other mineral wealth be bought in our domestic currencies? The answer is simple, you demand for your mineral wealth to be bought in your domestic currency because it increases demand for your currency which raises its strength when you later exchange it for forex making you the benefactor of your own mineral wealth. By selling minerals for foreign exchange rather than your own African domestic currency you inadvertently strengthen foreign currencies and weaken your own national currency wiping out the gains from the fact that you own the mineral wealth being traded in the first place. Being thirsty for hard currencies makes pundits mistakenly believe selling their minerals for foreign exchange makes sense, but this is a shallow mentality, in a strong mentality authorities will demand minerals from African countries be bought with their domestic currency. This position requires the buyer first run around the financial markets in your economy with their hard currency in hand looking for your African country’s currency. In this position Financial institutions like banks begin to respect your local African currency because they see commercial interests who want your natural resources looking frantically for your local currency, moving from bank to bank to negotiate the best rate so they can purchase your precious minerals. This increase in demand pushes up the price of your currency causing it to appreciate. By the time an African government sells its minerals in its own currency not only is it securing a sale, its local banks are now full of the forex commercial interests used to buy your local currency. Your country has asserted its sovereignty (being owner of the sought after mineral assets) in the transaction as it has increased the respect for and the value of its national currency which it can now use to demand and command more forex than it could when it sold its minerals directly for forex. At present the WKP has African leaders thinking foreign currencies are more important than their natural resources. This is a fallacy leaders must overturn to give their people the dues from mineral wealth they deserve. The mentality of African governments should be, if a buyer can’t pay in local currency, then no sale – go and get the minerals you want somewhere else, and this should be a collective stance on the continent. African countries must never forget that the mineral asset being sold, not the forex being used to buy it, is where the true value and power lies in this type of transaction, so it is important never to become so thirsty and desperate for hard currency that you accept for your mineral wealth to be paid for in foreign exchange. This is a counter-intuitive process and African countries must begin to think outside the box that keeps them locked in poverty indefinitely.

The current trade system is designed to facilitate microeconomic transactions, however, it completely abandons the macroeconomic registry of these transactions, which consequently lack Central Bank facilitation, participation and supervision. This is one of the reasons why it should be noted that the objective of creating a single currency, for example for BRICS, the AU and so on though notable, is not as important as creating an ECH mechanism to govern trade between countries. Why? Well firstly, an ECH system or mechanism, when applied to trade preserves the cultural and national identity of participating countries by preserving their national currencies (it is not imperialistic) secondly it generates incredible amounts of finance, as observed earlier a global ECH applied to international trade would generate $20.9 trillion and growing per annum. I don’t envy anyone tasked with figuring out how to spend this self replenishing volume of funds every year.

The ability of Split Velocity to recover 100 percent of GDP per annum at constant price from the faulty CFI and reintroduce it to productivity in the national economy is often difficult to grasp, it is also difficult to appreciate how being able to put resources on this scale to work in a national economy can be wholly transformative. We would like to implement the pilot with other progressive central banks and governments that value innovation, especially in Africa and firmly believe that leaders who oversee the implementation of Split Velocity anywhere in the world, in their respective countries will be re-known for achieving the greatest increase in economic advancement and prosperity for their people than any other leader in history.

A Split Velocity model is designed to comprehensively wipe out scarce resources, poverty, unemployment and inflation in any country it is applied, within a generation.

It is based on a scientific approach to how to develop an economic system called Split Velocity.