Revolutionizing Money Supply Management in the Modern Economy
If you have been keeping up with Split Velocity, at this point you should understand that accounting negligence and malpractice which fails to distinguish between gains in GDP [at the macro level] and or Annual Total Revenue (ATR) [at the micro level] over time and the point in time losses created by financial architecture misinforms how Central Banks and Federal Reserve Banks manage money supply. They do not provide the point in time increases in money supply required to counter losses in the CFI. This accounting negligence forces businesses and institutions to mark up products or use cost plus pricing due to the fact that they are attempting to increase money supply to remain profitable, a practice that drives creeping inflation world wide. It forces economies to subsist on mark ups where growth ranges on average from 0% – 6%. Instead of 100% of the waste being recovered from the CFI must be restored to business and institutions. This accounting negligence and malpractice leads to business losing 100% of their ATR to the CFI for absolutely no relevant reason. Advisory and consulting services institutions and individuals have failed to advise companies and governments about this ongoing problem, instead they manage and remain fixated on subsistence gains from 0%-6% growth while remaining completely blind to 100% losses in the CFI. This negligence is the reason why scarcity remains high across the world and poverty remains unmanageable. These ATR losses must be restored to businesses and we designed the fintech with which to do this and correct this problem, namely, Split Velocity.
In an era where central banks continue to amass gold reserves amid geopolitical tensions and economic uncertainties, a paradigm shift is overdue. As of September 2025, global central banks are on track to purchase around 800–1,000 tonnes of gold this year, down slightly from the record 1,086 tonnes in 2024, yet still representing trillions in tied-up capital due to inadequate advisory services. Nations like China have extended their gold-buying streak to nine consecutive months, underscoring gold’s enduring appeal as a safe haven. However, this reliance on physical assets overlooks a more efficient, digital alternative: the Split Velocity (SV) model, grounded in the Punabantu Equation of Exchange. Developed by business management specialist Siize Punabantu, SV promises to transform monetary policy by enabling exponential economic growth without inflation, making the demand for gold greater than that driven by central banks. This article argues that SV not only outperforms gold in stabilizing money supply but also unlocks unprecedented productivity, urging central banks to rethink their strategies.
The Enduring Allure—and Shortcomings—of Gold Reserves
Gold has long been a cornerstone of central bank reserves, with global holdings exceeding 36,000 tonnes valued at over $3 trillion. In 2025, surveys reveal that 95% of central banks anticipate rising gold reserves in the coming year, driven by its perceived roles as an inflation hedge, geopolitical safeguard, and strategic asset. Proponents argue that gold diversifies portfolios, counters currency devaluation, and signals financial sovereignty—especially amid de-dollarization trends in emerging markets.
Yet, gold’s limitations are glaring. Purchases incur massive upfront costs, with central banks adding 244 tonnes in Q1 2025 alone at prices averaging around $2,500 per ounce (escalating to $3,675 by Q4 projections). Once acquired, gold sits idle in vaults, demanding ongoing expenses for storage, 24/7 security, purity audits, and insurance—running into millions annually per institution. Price volatility poses risks; a supply surge from mining could dilute value, while declines (as seen in 2013’s 20% drop) erode reserve strength and weaken national currencies.
Moreover, gold offers passive protection at best. It failed to prevent or mitigate the 2007–2009 subprime crisis, where reserves remained untouched amid economic collapse. Central bank gold buying, accounting for 20–25% of global demand, artificially inflates prices but stifles broader market growth by diverting resources from productive investments. Opportunity costs are staggering: Funds locked in U.S. gold reserves (valued at ~$500 billion) could instead address infrastructure deficits, hunger affecting 44 million Americans, or unemployment programs.
In essence, gold perpetuates a reactive, resource-intensive approach to money supply management, rooted in outdated models like the traditional Circular Flow of Income (CFI), which overlook systemic inefficiencies leading to inflation and stagnation.
Introducing Split Velocity: A Dynamic Alternative Powered by the Punabantu Equation
Enter Split Velocity, an innovative economic framework that addresses these flaws head-on. At its core is the Punabantu Equation of Exchange, a refinement of Irving Fisher’s classic MV = PT (where M is money supply, V is velocity, P is price level, and T is transactions). The Punabantu version, KV(MS/E) = PYR, introduces key components: R (operating system, representing transactions per cycle), S (emoney multiplier for balance restoration), E (emoney constrictor for efficiency), and K (virtual velocity from splitting).
Unlike Fisher’s equation, which assumes a linear economy prone to zero growth and treats velocity as aggregate, Punabantu’s model splits velocity into dual streams—capital (productivity-focused) and household (consumption-focused). This “split” allows money to perform multiple roles simultaneously per cycle (e.g., R=2), effectively doubling output along the Production Possibility Frontier (PPF) without price hikes. For instance, in a $300 billion economy, SV shrinks apparent money supply (M/E) while boosting virtual velocity (K), resulting in doubled GDP at constant prices.
The benefits are profound: SV creates a “price plane” where sellers lack incentives to inflate costs, enabling money supply to double annually tied to real productivity gains. Empirical tests, replicable using public GDP data, reveal 100% annual CFI losses recoverable through SV, projecting growth rates exceeding 15% without inflation, poverty, or recession. By advancing or boosting GDP by as much as 0%–100% per annum—recovering the full spectrum of CFI inefficiencies—SV fosters an environment of rapid economic expansion. Implementation is digital and cost-effective, leveraging electronic money creation at near-zero marginal expense—no vaults, no audits, no physical risks.
Head-to-Head: How Split Velocity Outperforms Gold
SV’s superiority over gold is evident across key dimensions of money supply integrity:
Inflation Control: Gold hedges against inflation but cannot prevent it. SV’s price plane eliminates inflation proactively by balancing money supply with output, making fiat more stable than gold (where supply doublings erode value).
Crisis Resilience: Gold provides passive sovereignty but proved ineffective in crises like 2007. SV accelerates growth during shocks, injecting funds into productive splits to boost employment and output, countering recessions dynamically.
Cost and Efficiency: Gold’s high acquisition and maintenance costs drain resources. SV operates electronically, freeing capital for infrastructure and social programs while unlocking exponential growth.
Market Impact: Central bank gold purchases artificially support demand but stunt organic growth. SV enhances purchasing power, naturally surging private gold demand (e.g., jewelry in booming economies) beyond what banks can buy, benefiting miners sustainably. Crucially, SV’s capacity to boost GDP by 0%–100% per annum amplifies this effect dramatically. For example, elevating an economy’s growth rate from 6% to 36%—achievable through SV’s velocity splits and CFI recovery—would increase per capita income and disposable wealth, driving demand for gold as a luxury or investment asset in far greater quantities than central bank purchases. Historical precedents, like China’s high-growth periods in the 2000s–2010s, show how rapid expansion correlates with jewelry demand spikes exceeding 1,000 tonnes annually, dwarfing current CB buys of ~800–1,000 tonnes.
Overall Stability: While gold is volatile and idle, SV transforms fiat into a durable store of value, doubling money supply at constant prices via the Punabantu Equation.
In short, SV addresses the root CFI defects that mislead central banks into gold dependency, offering a proactive, scalable solution.
Implications for Central Banks and the Path Forward
Adopting SV could redefine monetary policy, but resistance stems from entrenched practices. Accountants and advisors, bound by professional standards, risk negligence by ignoring SV’s empirical evidence in favor of gold—potentially actionable under frameworks like the U.S. Federal Reserve Act or EU’s Treaty on the Functioning of the European Union. As surveys show increasing active gold management (up to 44% in 2025), it’s time for pilots of SV technology to demonstrate its potential.
In conclusion, while gold has served economies well historically, Split Velocity represents the future: efficient, inflation-proof, and growth-oriented. Central banks must embrace this innovation to foster resilient, equitable prosperity—before another crisis exposes gold’s limitations once more. A balance needs to be struck between an effective tool like Split Velocity and gold purchase where the advantages of both are used to leverage and manage money supply.
This paper introduces the Split Velocity model as a transformative approach to economic systems, addressing the inefficiencies inherent in the traditional Circular Flow of Income (CFI). By achieving 100% recovery of losses within the CFI, the Split Velocity model establishes a lossless economy characterized by a baseline 1:1 return on investment over a one-year period. This contrasts sharply with the current zero-growth economy, where baseline returns are effectively 1:0, leading to reliance on cost-plus pricing, creeping inflation, and heightened financial risk. Through theoretical analysis, the paper demonstrates how the Split Velocity model balances money supply with productivity, creates price stability via a “price plane,” reduces inflation, lowers investment risk, enhances returns, and accelerates economic growth. The model fosters a well-oiled economic machine where productivity booms are matched by sustained demand, making it superior to the inflation-prone, inefficient status quo.
Introduction
The concept of the time value of money (TVM) is fundamental to financial decision-making, encapsulating the idea that a dollar available today is worth more than the same dollar in the future due to its potential earning capacity. In practical terms, TVM prompts the question: If an investor has one dollar to allocate from day one over a 365-day period (one year), where should it be invested to maximize percentage gain? Traditional options range from low-risk assets like treasury bills or government bonds to higher-risk instruments such as stocks or cryptocurrencies like Bitcoin.
However, the current economic framework, built on a flawed Circular Flow of Income (CFI), often results in a zero-growth baseline where the expected return on that dollar is zero (1:0). Businesses counteract this through markups or cost-plus pricing, which induces minimal GDP growth but perpetuates inefficiencies, inflation, and risk. This paper proposes the Split Velocity model as a superior alternative. By fully recovering losses in the CFI, the model creates a lossless economy with a baseline return of 1:1, meaning a one-dollar investment yields one dollar in return by year’s end. This shift not only minimizes risk and inflation but also amplifies returns and economic growth, offering a more efficient system for governments, businesses, and individuals.
The Flawed Circular Flow of Income and the Zero-Growth Economy
The traditional CFI model depicts the economy as a cycle where households provide factors of production to businesses, receiving income in return, which is then spent on goods and services. However, inherent flaws in this model lead to withdrawals (e.g., savings, taxes, imports) that disrupt the flow, creating losses that manifest as economic stagnation.
In a zero-growth economy, the baseline TVM is 1:0: a dollar invested over one year yields no net gain due to these systemic losses. To mitigate this, businesses employ cost-plus pricing, adding markups to cover costs and generate profits. While this strategy induces slight GDP increases, the gains are largely subsistence-level, reliant on marginal economic expansion. For instance, at the microeconomic level, individual investors might achieve 26% returns in cryptocurrencies, yet the macroeconomy may only grow by 6% annually.
Cost-plus pricing exacerbates inflation. When businesses markup prices, they effectively demand money that does not yet exist in the economy. Consider a simplified example: an economy with $10 in circulation and one mango. If a business prices the mango at $13 to secure a $3 profit, the additional $3 must be supplied by the central bank. This increases the money supply without a corresponding rise in productivity, resulting in creeping inflation. Central banks, compelled to expand the money supply to facilitate transactions, further fuel this cycle. Inflation, in turn, elevates financial risk, deterring investment and perpetuating inefficiency.
The current system thus traps economies in a quagmire of high risk, low returns, and inflation proneness. Governments, businesses, and individuals operate in an environment where productivity is mismatched with demand, and economic growth is stifled by these structural deficiencies.
Introducing the Split Velocity Model
The Split Velocity model addresses the CFI’s shortcomings by applying a mechanism that achieves 100% recovery of losses, effectively splitting and optimizing the velocity of money flows. This creates a lossless economy, where the baseline return on a one-dollar investment over one year is 1:1—representing zero net loss and full preservation of value.
At its core, the model ensures that businesses can invest in capital without subtractions from households, while household purchasing power remains intact. This dual preservation eliminates withdrawals that plague the traditional CFI, leading to a harmonious balance between supply and demand.
A key innovation is the establishment of a “price plane,” where businesses set prices without strong incentives for changes. In this framework, a business can achieve up to 100% profit at a stable price point, obviating the need for markups or cost-plus pricing. The price plane arises because the model aligns money supply precisely with productivity gains, preventing artificial inflation.
Benefits of the Split Velocity Model
Lower Inflation and Price Stability
Unlike the current system, where cost-plus pricing necessitates money supply expansions, the Split Velocity model synchronizes monetary growth with real productivity. This resistance to inflation stems from the elimination of needless markups: businesses recover total revenue lost to CFI flaws, allowing profitable operations at fixed prices. Creeping inflation is curtailed, as central banks no longer need to inject unbacked currency to bridge pricing gaps. The resulting price stability reduces uncertainty, fostering a predictable economic environment.
Reduced Financial Risk
Inflation inherently amplifies risk by eroding purchasing power and complicating investment forecasting. The Split Velocity model’s inflation resistance thus lowers overall financial risk. With a baseline 1:1 yield, investments become safer across asset classes—from treasury bills and government bonds to stocks and cryptocurrencies. The absence of CFI-induced losses means capital investments face no unwarranted subtractions, making the model the safest and least risky financial asset class available.
Higher Returns
The baseline 1:1 return sets a floor for investment yields, but the model’s potential for exceeding this is substantial. Businesses thrive on restored revenues, driving productivity booms. Since household consumption is not compromised, effective demand matches this increased output, creating a virtuous cycle. Investors are drawn to opportunities where a one-dollar input can reliably yield one dollar or more, enhancing attractiveness across markets. This contrasts with the zero-growth baseline, where returns are capped by minimal GDP increments.
Accelerated Economic Growth
By functioning as a “well-oiled machine,” the Split Velocity model accelerates growth through unchecked productivity and sustained demand. No longer hindered by inflation or CFI losses, economies experience rapid expansion. Commercial interest surges, as lower risk and higher baseline yields encourage investments in stocks, bonds, and even riskier assets like crypto. The model’s lossless nature ensures that growth is not subsistence-based but exponential, far surpassing the 6% macro growth seen in inflationary environments.
Comparative Analysis: Split Velocity vs. Current Economy
Aspect
Current Zero-Growth Economy
Split Velocity Model
Baseline Return
1:0 (zero net gain)
1:1 (full preservation and potential for more)
Inflation Mechanism
Cost-plus pricing drives money supply increases
Balances money supply with productivity; price plane stability
Risk Level
High due to inflation and CFI losses
Low; inflation-resistant and lossless
Returns
Subsistence gains tied to tiny GDP growth
High baseline with strong upside potential
Economic Growth
Stagnant, inefficient, inflation-prone
Accelerated, productive, demand-matched
Investment Appeal
Deterred by risk and low yields
Enhanced by safety and lucrativeness
The table illustrates the stark superiority of the Split Velocity model. In the current system, inefficiencies force reliance on inflationary tactics, yielding a high-risk, low-growth trap. The Split Velocity alternative eliminates these pitfalls, promoting a efficient, growth-oriented economy.
Addressing Malpractice in Managerial Finance and the Imperative for Reform
A critical oversight in managerial finance lies in its malpractice and negligence, particularly the inability to distinguish gains accrued over time from losses incurred at any instantaneous point, as reflected in GDP and Total Revenue (TR) metrics. This accounting flaw has profoundly skewed global economic practices, steering humanity toward pervasive poverty, artificial scarcity, and immense suffering and strife by perpetuating inefficient resource allocation and systemic imbalances. Professional advisory firms, which guide key stakeholders including governments, Congress, Parliament, businesses, shareholders, investors, and the general public, bear responsibility for this negligence and must address it forthwith through rigorous reforms in financial reporting and analysis. The Split Velocity test demonstrates empirical validity through its application to real-world economies, such as the US, revealing imbalances between household consumption and capital investment that align with observed economic distress; it is admissible under established economic laws like the Quantity Theory of Money and principles of monetary velocity, as well as international accounting standards that emphasize accurate temporal valuation. Every effort must be made to rectify this issue, restoring TR to businesses and cultivating an economy with diminished risk, negligible inflation, and elevated performance in stock markets and other financial instruments, thereby delivering substantially greater returns for investors.
Conclusion
Advancing to a Split Velocity model represents a paradigm shift from the flawed, inflation-prone zero-growth economy to a lossless system of lower risk, higher returns, reduced inflation, and accelerated growth. By recovering CFI losses and establishing a price plane, the model ensures balanced money flows, booming productivity, and matched demand. Governments, Congress, Parliament, businesses, and individuals stand to benefit immensely, operating in an environment where the time value of money is maximized safely and lucratively. Future research could explore empirical implementations, but the theoretical advantages outlined here underscore the model’s potential to revolutionize economic structures.
Why can businesses not sell normal goods at cost price and prosper? They can and should be. In fact businesses can sell normal goods at cost price and make as much as a 100% profit. They can even mark up products in a Split Velocity model and not worry about inflation because the model works constantly to counter it. They can do so in an economy that has little to no inflation or deflation and have the opportunity to grow with much greater certainty.
Once they can do so inflation caused by the pressure to increase prices tails off and moves into a “price plane”. A price plane is the tendency of the general price level to remain the same or constant for long durations of time bringing problems such as creeping inflation to an end. Ceteris paribus, a loaf of bread or mealie meal in 2025 will have the same price in 2505.
So why do they mark up?
There are two reasons why businesses mark up goods and services they sell. The first reason is obviously they are profit seeking. However, we have shown that in a Split Velocity model businesses can sell their products at cost price (hence with no profit) and still make a 100% gain as well as operate in an economy free of inflation. This is how a normal economy should function. If this is true then why do businesses mark up their products? The systemic reason why businesses mark-up goods and services is because of the defective CFI. As explained, the defective CFI is losing or wasting 100% of GDP per annum. This is an insane amount of useful finance. This hidden loss is part of the Western Knowledge Paradigm (WKP) which has mistakes nearly every country in the world applies and downloads into how its economy operates and is managed. The WKP is treated by African and other nations as the stuff of legendary genius studded with accolades and prizes to boot. However, it is riddled with flaws, misconceptions, bad decisions and outright mistakes, like the hidden annual losses caused by the CFI. These flaws, mistakes and misconceptions are also found in the WKP’s sciences. Nations need to be wary of the WKP and its flaws.
Its a 100% inefficient economy: The evil and diabolical system called the defective CFI is what keeps humanity bound to poverty and scarcity, if you don’t know, can’t recognize what it is doing or understand your enemy, you cannot defeat it.
Central banks trained by the WKP are unaware of inefficiencies in the CFI, referred to as implosion or subtraction in the book Greater Poverty and Wealth of Nations (2010), they do not act to counter it. For example, in Zambia there is ZMK700 billion in liquidity missing from the economy (US$28bn), .i.e. equivalent to GDP in 2024 that represents useful financial resources that could have been introduced by the central bank at constant price if a Split Velocity model were introduced (this is enough finance to pay off all of Zambia’s debt in one go, without batting an eyelid). These useful resources are arbitrarily lost to the CFI every year. Central banks are generally not aware that this liquidity needs to be restored by minting or creating new money and channeling it through a Split Velocity model as an economic stimulus at constant price. Therefore, they do nothing to correct money supply. Like everyone else the WKP makes them assume the CFI over time is perfect, when in fact at any point in time it is losing the equivalent of GDP to nothing more than the inefficient design of the CFI. This is an insane, dumbfounding amount of money and resources especially when many countries face great want, poverty and underdevelopment. [Accounting & Audit firms where are you? Its time you woke up. Your clients need you.]
Businesses find they have to step in and start “printing” or creating their own money
As a consequence of this finance (equivalent to annual GDP) missing from the economy (due to the CFI being faulty) businesses are forced to step in and play the role of clueless central banks, which is to create money in the economy. How are business “printing” or creating money out of thin air? This is how: If a good costs $100 and a business sells it for $120, internally or from the micro-view it appears to simply be marking up its goods and services, the truth is that from the systemic or macro-view it is attempting to do the work of a central bank. Central banks led by the WKP are dumbfounded and have no idea that this is their role. The consequence of this is that businesses must take matters into their own hands and begin to “print”, create or mint their own new money. Hence, the mark up is introduced. In an economy worth only $100, and therefore with only $100 in circulation, the business in our example prices its product with a $20 mark up. There is only $100 in circulation. The business is charging $120 for its product. The mark-up of $20 is the business creating new money that does not exist in the economy. Why?, because the central bank under a WKP has no idea this is its job to do.
We call this attempt to create or “print” money cost-plus-pricing, marking up or the more popular term is “profit”. However, creating money is a role that is meant to be exclusively under the jurisdiction of a central bank. The Fisher Equation MV=PY cannot play this role, its not designed to do this as it creates a financial system that cannot contain inflation, which is why the new Punabantu Equation of Exchange KV(MS/E)=PYR is introduced to create a more robust system that can handle the increase in money supply at constant price, referred to as a Split Velocity model. Businesses, unbeknownst to themselves, are trying to recover money the economy is losing to the CFI equivalent to GDP per annum using mark ups, a role that belongs to central banks.
If businesses tried to sell a product at $100, the defective CFI would claim this value using subtraction in the CFI, and instead of seeing this loss is being caused by a 100% drop in efficiency caused by the faulty CFI businesses, instead of rejecting this loss, out of error, embrace it and refer to this loss to the business as the “cost of production” or “the cost of doing business”. This is a huge mistake on the part of enterprise and where the term “sleight of the hand” applies as we saw earlier with the shuffling of cups and palming of the ball. The palming of the ball is used to illustrate a 100% loss of revenue by businesses to the CFI for absolutely no reason other than that it is of defective design. Businesses at present are completely unaware of this huge loss from their balance sheet equivalent to 100% of revenue occurring at any point in time. They are clueless and continue operating with the ignorance of this loss or deduction of finance from their operations, of which the only indication is usually how difficult it is to finance operations that keep their going concern afloat and how difficult it is to move their businesses toward growth. Under the strain of losses equivalent to annual total revenue, running a businesses becomes like trying to run and move through molasses, many businesses wind up, shut down and the founders or team of entrepreneurs give up, without ever knowing what they were really up against. Similarly, in the same way that businesses struggle, as a result of the WKP central banks are unaware that they have a primary role of resolving inefficiencies in the CFI to recover and restore this finance to the operations of businesses. The lack of efficiency in the CFI pushes back the production possibility frontier significantly in real time. It is a genuine loss in finance that triggers a loss in productivity that severely retards economic growth. This vacuum of income that should be in the hands of productivity is why countries experience remarkably slow single digit rates of economic growth each year. This process triggers world-wide scarcity, poverty and stifles genuine prosperity.
Therefore, businesses and entrepreneurs are being fooled by the economy or CFI in two critical ways. First is the belief that they need to add a markup to realise a gain when they trade. This gain, when aggregated is miniscule and becomes the mediocre 1%-7% gain in GDP we observe in many economies. The example we used is the 20% mark-up of $20*. This mark up, in real terms, is an attempt to create money due to central banks misled by the present day WKP failing to play their role because they are led to believe the economy is functioning normally over time .e.g. a period of 1 year.
The second manner in which businesses and entrepreneurs are being fooled by the CFI is that when they allocate income earned to factors of production, which we represented with $100**, they are unaware that this is in fact an allocation to subtraction or implosion in the CFI, which the central bank not businesses is supposed mitigate using a Split Velocity model. This overlap makes it nearly impossible to see the loss taking place in front of their eyes, in broad daylight – hence it is referred to as the “sleight of hand trick” played by the CFI and the shuffling of cups where the ball is palmed is used as a method for illustrating how businesses and entrepreneurs lose total revenue (TR) annually to the CFI right before their eyes and are clueless about this real loss because their own “eye to hand” co-ordination and observation tells them they are paying for the cost of production (they see the ball go under a specific cup), when in fact, in real terms, they are allocating this finance to the faulty CFI where it is simply wasted (the ball is palmed). When entrepreneurs try to operate their business with this finance (the cup is lifted and there is nothing but air underneath it) they accept the loss because they think the payment went to the cost of production, unable to determine they have been “scammed” by the CFI they operate their going concerns wondering why running a business is so hard.
The faulty CFI and its hidden loss equivalent to 100% of GDP per annum would imply that the present civilization that applies it has to be the “dumbest civilization in the universe”, or if it is seen as a deliberate tool for economic oppression then it can be described as “the smartest, most diabolical method for human economic subjugation ever conceived” so evil and pervasive that it can function right before human eyes and intellect, in broad daylight and yet defy detection.
A result of the WKP is that every business and institution in the world, in operation today, loses the equivalent of its total revenue (TR) annually to the CFI, for no reason whatsoever, other than its 100% inefficient and ineffective design.
African nations and leaders must familiarize themselves with the WKP’s substandard economic and financial system proliferated by the CFI, because it is they and their people who, facing the worst circumstances, bare the brunt of its negative outcomes and vulnerabilities.
* It is easily shown that in a Split Velocity model a business can sell a product at cost price and still make a 100% gain that is equivalent to profit [even though technically it is not referred to as profit]
** Businesses and entrepreneurs remain completely clueless about this loss because the CFI masterfully, in the most sinister and evil way acts to hide this loss by using costs of production to shadow subtraction (palms the ball) which robs businesses annually of the equivalent of their total revenue every year.
When a business spends $100 to produce a product, then technically there is only $100 in the economy to buy it. When this business marks up its product to $20, it is trying to create new money by asking for money that does not exist in the economy to buy its wares. The next time you see products lined up on shelves, remember that what you are seeing from the macro-view is businesses trying to create or print money that does not exist in the economy because of a weak WKP. If a central bank does not act, the absence of the $20 will cause deflation (which can be just as disruptive as inflation). The other option is for the central bank to increase money supply over time by $20 to solve this problem. However, in doing so it facilitates the continuity of trade but then inadvertently supports a process that has come to be identified as creeping inflation. This is due to the fact that in a normal economy run on the Fisher Equation (MV=PY) any increase in money supply without a corresponding increase in goods will cause inflation.
Creeping inflation then becomes ongoing as it is grafted into the very manner in which a WKP economy operates since the business is selling a product for $20 more than the system has been designed to accommodate, with no increase in production. Hence, generally over time goods and services become more and more expensive and the domestic currency loses value in a manner that is fundamentally outside the control of a central bank. A loaf of bread or bag of mealie meal in 1975 will not cost the same in 2025. People find they have to work harder to afford the same basket of goods. They have to take on more jobs to maintain the same life-style and they eventually begin to suffocate under living conditions where affordability persistently escapes their attempts to hold onto it.
However, if businesses do not mark up products they cannot survive due to the fact the hemorrhage of resources being wasted pointlessly by the CFI is pushing them down toward or keeping them below break even until they are forced to eventually shut down. Businesses are therefore today, unbeknownst to themselves, literally in a life and death struggle against the economy they operate in. They are groomed to believe the economy they operate in is helping them, when in fact it is trying to kill or shut them down – every hour, every single day. This is due to the inordinate yet unaccounted for losses taking place in the defective CFI of which even businesses themselves are completely unaware. These losses apply to businesses of any size, be they the corner grocery store, ntemba or multi-billion dollar conglomerate. They remain dumb about it due to the “sleight of the hand trick” played by the CFI which forces all business to lose 100% of their total revenue (TR) per annum as a hidden loss to their operations, when you add up this loss to all businesses or productivity in an economy it becomes equivalent to GDP. There cannot be a more sinister or more evil system than this as it robs humanity of sorely needed income and resources like a pierced jugular bleeding profusely that is draining the life out of humanity, hindering productivity, destroying businesses and entrepreneurs.
This is a sophisticated loss that requires exceptionally astute minds to identify. However, as mentioned earlier due to the limitations of the widely accepted and applied WKP central banks are presently unaware of losses taking place at any point in time in the CFI that are equivalent to GDP and assume the economy is perfect (study the Empirical Test for Split Velocity to understand this). Hence they assume the life and death struggle of business is “normal”, and like a public hanging of businesses by the faulty CFI, sometimes the public comes to watch the spectacle in the town square or on social media as a form of entertainment or news. Central banks are not to blame for this problem, the blame falls squarely on the WKP being applied today.
In this sense the central bank is like the life guard, who is supposed to be supplying the economy with money (in a Split Velocity model) at constant price equivalent to the deficit caused by the CFI so businesses can operate normally. However, because of a substandard WKP it is unaware that the CFI is defective and that losses equivalent to GDP are taking place and nothing is done to intervene. Therefore, the WKP, as it stands at the shore views and describes the desperate businesses with hands waving for help and in need of rescue as excitement, attention seeking and revelry; businesses are making hand gestures in rough waters for fun and attention, and when businesses drown its assumed they have just gone down into the water scuba diving. This ongoing ignorance brought about by the WKP, that has been ongoing for 250 years since Adam Smith, is the brutal tragedy and reality of economics, accounting and finance that is the origin of strife in the 21st Century. Over the last 250 years it estimated that $3,120 trillion in global GDP has been lost to the defective CFI. Global GDP flounders at around $110 trillion today with a global per capita income of $13,900, when in reality it should be at around $3,230 trillion with a per capita income of $398,765 per person. The progress humanity has lost over the past 250 years is truly mind boggling.
Every economy in the world has the latent internal resources with which to finance the doubling of GDP in one year at constant price. In order to exploit this we must move ahead of the current WKP, realize that it is fallible and avoid its pitfalls. What difference would being able to recover 100% of GDP from the faulty CFI make to your country applied over the next 50 years? How much more could you do and achieve if being able to recover 100% of total revenue every year from the faulty CFI were restored to your business or institution?
This is what we designed Split Velocity to achieve.
This is a basic introduction to the new Punabantu Equation of Exchange which supersedes the Irving Fisher Equation of Exchange. The new Punabantu Equation of Exchange demonstrates how Split Velocity is able to increase GDP at constant price by introducing additional “virtual” (split) velocities that allow money to act as a stimulus without inflation due to variances in velocity.This process facilitates the doubling of GDP in one year at constant price by recovering losses being induced in the economy by the defective CFI.
T-total number of transactions made over a period of time
P- value of money
T in the Fisher Equation is not ordinarily linked to output due to the linear economy’s disposition toward zero growth; therefore an increase in transactions ( as it is with an increase in money supply) in a linear economy will be limited by implosion [subtraction in the CFI] and not necessarily lead to an increase in output. However, in a dynamic economy T, which functions on a different growth principle based on split velocity is equated directly to output and is therefore converted to Y or an index value of the physical volume of output in the economy. Therefore, PY in the equation corresponds with GDP.
The Fisher equation is correct as an identity, however, this identity is incomplete as it leaves out one of the most important factors that determine the productive capacity or performance of money in an economy which in turn directly influences the efficiency of production and the general level of output. This factor is the economic operating system in which money (M), Transactions (T) or Output (Y), Velocity (V) and Price (P) function. The operating system is denoted by the letter (R).
The operating system (R) is the number of transactions or allocations of money per cycle. By not including R in the Fisher Equation monetary and fiscal policy as a means of facilitating economic growth and expansion are severely limited.
The world’s economies today function on one transaction (Y) per cycle, that is, R=1. In other words an economy where Y=24 bn has approximately 24 bn transactions per annum occurring at a pace of 1 transaction per cycle, in this case, the cycle is measured over one year. If the economic system where to change to 2 transactions per cycle, that is, R=2, at constant price then output would be YR or 24×2= 48 bn. In other words over the same period of time, that is, 1 year ceteris paribus, the economy could gain the resources to double in size. Instead of one transaction taking place when expenditure takes place the system can make that routine expenditure automatically perform two or more transactions even though the one active expense and choice was made. For example, when a business pays for capital rather than just one transaction taking place the same value is also automatically paid to labour thus performing two transactions in simultaneously. The system (R) determines the rate or pace of productivity though it is not part of the Fisher Equation.
The fact that R=1 makes the ‘operating system’ an invisible property that is not found in the Fisher Equation. It has not been taken into account when using it to formulate policy on money supply in the same way that an equation where the multiplicative factor is constantly 1 will inevitably ignore the factor’s presence. This ‘invisible force’ and the inability to see or account for it is one of reasons why monetary policy has become increasingly unsuccessful in attempts to catalyse growth in modern economies. R can be made visible on the right hand side of the Fisher Equation showing that the system (R) or number of transactions per cycle, determines how many transactions (Y) will take place over a period of time e.g. 1 year:
The system (R) is a module of efficiency. An increase in T is a consequence of a rise in the efficiency of output as a result of a rise in productive efficiency. In the same way that a car travelling at twice the velocity will cover twice the distance over the same period of time the efficiency of R=2 raises the pace of productivity producing twice the volume of output over the same period of time, that is, 1 year.
Money is like a fuel. The more of it the economy burns to do the same work the less efficiently it is functioning, hence inflation is a result. Similarly, an increase in R which is an increase in efficiency has the inverse effect on money supply. It causes output to increase but money supply to shrink (deflation). The less money needed to create output the more efficient the economy. R affects money supply inversely by increasing the efficiency of money which contracts money supply while it raises the volume of output (Y) inversely. The influence of the factor R appears on the left side as:
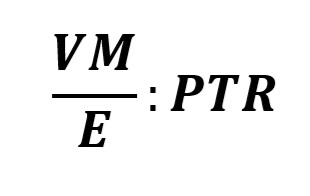
Where R=E
.i.e. VM/E:PTR
The operating system R also affects the velocity of money. When the velocity of money changes it has an interesting effect in that it functions as though there are two economies operating in one space. This occurs as a result of a combined velocity which keeps the velocity of money constant, but working with twice the efficiency. It is based on the system’s dual structure the process which is to be discussed later in this paper. The factor by which R affects the velocity of money will be denoted as K, (where K=R).
.i.e. KV(M/E):PTR
However, when the system changes from R=1 to R=2 a money supply deficit is created. There is not enough money in circulation to satisfy the growth in transactions and circulation of goods and services throughout the economy, hence, there arises an inequality seen in the equation above caused by (M/E). When money moves in more than one direction, from one transaction simultaneously performing more than one task, the balance between money supply and productivity must be restored, hence, this adjustment remains within present day monetary policy rules or regulations. The balance is restored by adjusting by S. S is the principle on which split velocity at constant price becomes possible. To do this the fall in money supply (as a result of a change in the system (R) must be increased by R to remain balanced with output. This adjustment at constant price is denoted by S, (where S=R). This last step is significant in that it shows that by changing the system money supply can be turned into a catalyst for growth and development (The stock of money and its behaviour 1-9 provide a more graphic explanation). The final ratio is thus:
The new identity and complete Equation of Exchange, which includes the system in which money functions is as follows:
Where
R – operating system
S – emoney multiplier
E – emoney constrictor
K – virtual velocity
S,E and K are working parts of the operating system dependent on R
In a balanced operating system R=E=K=S
If R=1 in the above equation this reduces it to the original Fisher Equation MV=PT silencing R,E, K and S. This makes the system seem invisible or inconsequential and illusive while it is in fact a useful and yet a missing economic tool. The fact that economies today are linear and function on R=1 entails that MV=PT in a constant operating system. When the system is changed and made to perform dynamically where R>1 or R=2 this creates a sudden money supply deficit or a sudden deflation of 1/R allowing new resources to be created by S (where S=R) simultaneously allocated to capital and households [Split Velocity]. This restores the balance between money supply and output and as a result takes place at constant price in the new system (R=2 or R>1). Inflation does not take place due to the fact that the velocity of money is split allowing it to move in two directions simultaneously. As R is increased on the basis of split velocity as a technological advancement in the use of emoney output or GDP grows by the same rate within the capacity of the technology paradigm. Ceteris paribus by adjusting an economy by R=2 its GDP will double over the same period namely one year supported by the technology paradigm.
R is by no means simply a multiplicative factor, it is part of an operatingsystem. In other words not only does it affect volume it can be manipulated to do so intelligently by changing the process by which allocation takes place thus creating an inverse relationship between money supply and output that can be exploited to catalyse growth and development equally. The equation is systemic meaning it is like a weaving process, the strands or components of the equation may remain the same or be altered, but what is most significant is that the ‘operating system’ or method of weaving changes. The weaving process in this case is the simultaneous allocation of income or finance to households and capital that keeps the dynamic [money moving in more than one direction simultaneously] economy in balance. If the method of allocation raises the number of transactions per cycle this change creates new levels of efficiency, which in turn lead to higher GDP growth rates over the same period of time.
This means that an economy has at its disposal the CFI or “operating system” – (R) as a formidable tool with which to catalyse productivity other than through the four basic factors: money, price, output and velocity alone. R is the system in which these factors operate. A change in R can create a condition in which the four factors can be controlled to obtain desired economic results without negatively affecting an economy.
Making the invisible aspects of the operating system – R hidden in the Equation of Exchange visible is of immense importance to growth and development and opens up new avenues for eliminating poverty, recession and underdevelopment. Here is a more detailed and step by step introduction to the new catalyst and its equation.
The real stock of money (M) or hard cash (notes and coins) in an economy is fixed. It cannot rise or fall unless more or less hard cash is introduced. Money supply on the other hand is relative it can rise and fall despite the amount of notes and coins being constant.
The way the stock of money behaves however will determine how much money there ‘appears’ to be in an economy. For example, if the velocity of money is two. Though the real stock of money is only 300 bn it will have the impact on the economy of 600 bn (MV). Let us call this the Virtual Stock of Money (Vm).
The third factor that influences the stock of money M and the virtual stock of money Vm is the system in which it operates. The system is determined by the number of transactions per cycle. A cycle is the duration during which a single unit of money performs a single task. If the total stock of available financial resources or a unit of money can only be allocated to one task at a time e.g. producing or consuming, as is the case with the world’s economies today, then it is linear. If money per unit of currency were allowed to move from being linear (one transaction at a time) , that is, either producing or consuming to doing both at the same time then the number of transactions it is capable of performing per cycle would increase by 2 (split velocity) and the system would no longer be linear but dynamic. When (R=2) the Virtual stock of money falls by half or by the value of R.
What happens in 3 as a result of a change in the economic system is very important due to the fact that it means an inverse effect on money supply and GDP takes place. Altering the economic operating system* entails changing it from 1 transaction per cycle to two transactions per cycle. This increase in efficiency causes the supply of goods and services to rise while money supply falls. This inverse relationship is important. By introducing it between VM and PT it becomes possible to manipulate the economy using the economic operating system to restore the balance. The restoration facilitates a system that enables growth in output. It is something that it is practically impossible to do in a linear economy.
* Note that the operating system or economic operating system (eos) refers to the circular flow of income (CFI) and can be used interchangeably.
What happens in 4 is an important development as it means that by altering the CFI or economic operating system (R) governments can shrink the virtual size of money supply and allow it to be optimised , that is, on the dynamic principle [dynamic is two allocations of finance per transaction e.g. to households and capital, rather than just one], which uses this to create new resources for capital (industry) and households. The impact of this discovery is as important to growth and development as the impact of credit creation on investment and opens the door to a whole new net-cash catalyst industry that complements credit creation managed by the banking industry. The catalyst at R=2 is capable of generating new financial resources for eliminating poverty, it is capable of doubling output, doubling productivity, it increases financing available for public works and increases the impact of AID provided by domestic and international agencies. It is capable of putting nations back on track to recovery, economic growth, economic development and a higher general standard of living without some of the harmful consequences of interest rate cuts or utilisation of government reserves to finance public expenditure. It also significantly increases the resources available to banks for credit creation and to domestic and international AID/development agencies for programmes and projects. Furthermore, it significantly increases the dexterity with which central and federal banks can regulate an economy in order to protect it from recession and shocks.
When an economic system advances e.g. from being linear [where finance moves in one direction per transaction .i.e. Split Velocity] to being dynamic [finance moves in more than one direction per transaction], the efficiency of money (Em) rises (due to the Virtual stock of money falling thus enabling dynamic allocation). At a constant velocity of money the work done by a unit of money increases and when this happens the Virtual stock of money appears to shrink. For example, the real stock of money may be 300 bn. This money works at a velocity of 2. The economy behaves as though there is 600 bn circulating through it due to the fact that this money circulates through the economy twice per annum. It therefore sustains a GDP of 600 bn where the general price level is 25 and output is 24 bn.
If the economic [operating] system (CFI) changes from being linear to being dynamic , that is, from one transaction per cycle (R=1) to two transactions per cycle (R=2) the virtual stock of money will appear to shrink by half. This is due to money being made more efficient by performing two tasks simultaneously rather than one. This is as a result of a change in the economic system. (To illustrate this, it is like a mule (money) pulling a single cart (number of transactions) over a distance in a pace of time (velocity) required by the market. There is only one mule transporting goods and services (facilitating productivity). The mule is pulling its maximum load. No more transactions can be added to this system otherwise it slows the mule down (deflation) making it too slow to deliver its goods required by the market on time. Neither can another mule (additional money) be added to the same load to speed things up as the cart would arrive at the market before all its goods were ready for sale (inflation). By increasing the work done by money (R=2 transactions per cycle) another cart of equal size and load is harnessed to the mule. The load of productivity becomes too heavy for one mule to pull. This slows it down (making the stock of money shrink (virtual deflation). This alteration makes it possible to introduce another mule (new financial resources created by the operating system) to help tow the two carts at constant price. Now there are two mules pulling two equal loads (split velocity) facilitating twice the level of output (GDP) at the pace required by the market to get the goods there on time). The additional mule harnessed to a dynamic operating system (CFI) creates new resources 300 bn to 600 bn. When this happens the Virtual velocity of money (K) pushes this value up to 1.2 trillion at constant price. This is necessary since the velocity of money flowing in either direction (toward capital and toward households) remains constant at 2. The split in allocation (split velocity) creates two economies functioning simultaneously, namely the capital economy working at a velocity of 2 and the consumer economy working at a velocity of 2. This creates a combined virtual velocity of 4 per annum, however, money is moving only at a velocity of 2 per annum in its respective capital and consumer economies which though fully integrated are separately fueled (by money). In consideration of the older Fisher Equation even if ‘transactions’ remains constant since money appears to be operating in two economies. This split velocity is extremely important as it keeps the general price level at 25 while output increases from 24 bn to 48 bn. It keeps the velocity of money at 2 (in each economy) allowing the stock of money to grow from 300 bn to 600 bn. This will be reflected by the value K in the equation. A change in the economic [operating] system (CFI) from R=1 (linear) to R=2 (dynamic) will cause the efficiency of output to double from 600 bn GDP per annum to 1.2 trillion GDP over the same period of time at constant price generally allowing a doubling of output in an economy per year.
The addition of 300 bn to the real stock of money restores the deficit created by advancing the financial system from R=1 to R=2 (M/E) and this restoration (S) at a constant velocity of money of 2 doubles the output from 24 bn to 48 bn raising GDP from 600 bn to 1.2 trillion over the same period of time. This situation keeps the economy in balance with 1.2 trillion VM servicing 1.2 trillion GDP. The dynamic economy or dynamic operating system is in this case twice as efficient, twice as productive, twice as able to provide and twice as stable as the linear economy. When the system remains linear, that is, R=1, as the world’s economies are today, then GDP growth rates will be encouraged to balance at zero. In other words linear economies are designed to remain stagnant [this stagnance or lack of growth is why a linear economy is referred to as a “zero growth economy”] To grow they must rely on cost plus pricing, more on which is discussed later. This is why they annually produce such poor levels of output that economies and economists have become accustomed to. To overcome stagnation industry and households have to ‘overwork’ themselves or use surplus efficiency to survive. The result is a salvaged annual GDP that often resides between a paltry 0-10% per annum. When GDP accelerates to levels as high as 65% as observed in some oil producing countries as a result of oil, the economy is not inherently designed to distribute wealth equally between capital households thus leading to growth without development, that is, growth while poverty levels remain high. This causes adverse or artificial scarcity from which present day poverty and its plethora of socio-economic problems arise. The switch from a linear to a dynamic operating system at (R=2) doubles the level of financing in an economy, ceteris paribus, allowing a doubling of GDP over the same period of time. It means that the US economy has the potential to grow from US$12.5 trillion in GDP (IMF 2005) to US$25 trillion in one year ceteris paribus; the US government may not need all these resources and may not need the economy to grow this quickly and could instead capture the percentage of these resources it felt was required for its population and needs. It means that the South African government has the potential to make the South African economy grow from US$240bn (IMF 2005) to US$480 bn a year. It means that the EU could make its economy grow from US$13.5 trillion (IMF 2005) to US$27 trillion in a year. It means that the Zambian government cold make the Zambian economy grow from US$7.3 bn to (IMF 2005) to US$14.6 bn in a year. Since this Operating Level Economics (OLE) .i.e. circular flow of Income economic method acts as a catalyst this growth is natural allowing the economy to expand the same way it would if left to itself except in a much shorter duration of time. There is no hocus-pocus involved. Nations are in this case no longer limited by the linear operating system’s implosionary limitations [limitations caused by subtraction] and losses that lead to very low annual growth rates. They can grow much faster and at a rate that they deem fitting. Any well managed linear economy can increase GDP in this way without breaking a sweat due to the fact that it is already operating at level required to do so only implosion [subtraction in the CFI] dissipates the potential output it should naturally have access to. Dynamic allocation naturalises or balances productivity and output that implosion [subtraction in the CFI] in a linear economy has kept persistently unequal. When economies become dynamic [more than one allocation of finance per transaction] they acquire a rate of growth that they should have been exposed to all along. Artificial scarcity and the problems it creates are no longer a limit to what governments can achieve for betterment of their people. If the US government felt that it needed to grow by only 36% more in a year to create enough productivity within the US economy to wipe out industrial stagnance, squalor in inner cities, poverty, unemployment and create a general standard of living in line with government policy then the US Federal Reserve Bank would regulate the economy to R=1.36 rather than the full R=2. In other words it would capture only 36% of its total potential to grow in that year as allowing growth by the remaining 64% may be considered too excessive or extravagant for the existing population. A balance is thus found that avoids the problems caused by adverse scarcity and adverse surpluses. For African nations trying to find sustainable resources for projects like NEPAD transforming from a linear to dynamic operating system provides an alternative route to sustainable development and development financing. In this case governments are in a better position due to the fact that they control the availability of resources rather than being controlled for the worse by artificial scarcity, which is averse to socio-economic development.
Finally, the new equation for money moves on from the monetarist Fisher Equation:
MV=PT
To the new Punabantu Equation of Exchange:
Where R=E=K=S R is the economic [operating] system in which Money (M), Velocity of money (V), Price (P) and Output (Y) function. The values R=E=K=S in the equation [above] remain equal. Money Supply M has to be multiplied by whatever it is made to virtually shrink by 1/E. In this case money supply is made to shrink by the economic system R=2 therefore the real stock of money has to be increased by the proportionate value of R which is represented as S otherwise there will be a deficit in the real stock of money M. However, this increase takes place on an alternate velocity thus causing no change in the general price level, but rather the alternate side effect, that is, an increase in growth. To prove this S can be cancelled out by R in the equation (also using a concept of mechanical efficiency) due to the fact that though money supply is doubled (from 300 bn to 600 bn) to facilitate productivity in the restructured economic [operating] system its virtual value remains 300 bn due to the fact that it does not change along the same velocity. This is an important benefit of dynamic allocation. M is a real quantity while R, its common denominator, is a virtual one determined by the mechanical level of efficiency present in the economy (R=2). Modern economies are linear systems (R=1). Any attempts to increase money supply will lead to an increase in the general price level (inflation). The dynamic economy therefore offers new hope to ailing economies as a catalyst with which to boost productivity and consumption equally without using external resources. It is also a new tool by which to increase and accelerate annual GDP growth rates and bring an end to poverty, unemployment, stagnation and economic instability.
The equation satisfies both Monetarist and Keynesian schools of thought in that it creates new resources in S to catalyze productivity and yet the increase has no impact on inflation due to the fact that it is cancelled out by 1/E. K,V,S and E become constants. K is representative of the fact that money flowing to consumers (households) and capital (raw materials, equipment, repayment of loans etc.) does so at the same velocity (V), however, they take place simultaneously creating a Virtual Velocity (Vv) of 4 (Vv=KV=2×2) seen by a dual economy delivering financing output at the same velocity, but at double the volume (two carts: split velocity). The change in R from R=1 to R=2 causes money supply to shrink (M/E) making it necessary to restore its value by S; (MS/E) This works fine since it allows the stock of money to double and yet appear to remain the same (adding another mule). Doubling goes hand in hand with it being allocated equally and simultaneously to capital and households creating the R=2 economy (doubling the load by adding an additional cart) in which growth and development rise equally rather than one above or before the other. The increase in productive efficiency allows the stock of goods to increase by YR rather than just Y over the same period of time (1 year).
In terms of the efficiency of money an economy shrinks by M/E and must be restored to MS by S were as the inverse occurs and output grows by YR where R=S.
The economic system R (the number of transactions per cycle) is a non-obtrusive catalyst. It acts inversely on money and output by increasing the rate of productivity that lowers money supply allowing it to be expanded while making it possible for producers to expand output. This allows economic expansion (growth + development) to take place rather than one at the expense of the other. This is a significant improvement in economic management.
OLE theory states that, ceteris paribus, every economy at any point in time contains within its economic operating system the latent financial resources with which to double its GDP in one year at constant price. Therefore, economies are capable of geometric gains in growth as opposed to the linear gains in GDP observed today.
The Fisher Equation and Punabantu Equation
The Fisher Equation is as follows:
MV=PT
This is an identity, where basically: M- money supply
V-velocity of money
T-total number of transactions made over a period of time e.g. 1 year
P- general price level
T in the Fisher Equation is not ordinarily linked to output due to the linear economy’s disposition toward zero growth; therefore, an increase in transactions as it is with an increase in money supply in a linear economy will be limited by implosion [subtraction in the CFI] and not necessarily lead to an increase in output. However, in a dynamic economy T, which functions on a different growth principle based on split velocity is equated directly to output and is therefore converted to Y or an index value of the physical volume of output in the economy. Therefore, PY in the equation as will be seen to correspond with GDP.
Moving from the Fisher Equation to the Punabantu Equation: The new identity and complete Equation of Exchange, which includes the system in which money functions is as follows:
Where
R – operating system
S – emoney multiplier
E – emoney constrictor
K – virtual velocity
Y – output of goods and services
S,E and K are working parts of the operating system dependent on R where R=E=K=S
If R=1 in the above equation this reduces it to the original Fisher Equation MV=PT silencing R,E, K and S. This makes the operating system seem invisible or inconsequential and illusive while it is in fact a useful and a yet missing economic tool in growth and development. The fact that economies today are linear and function on R=1 entails that MV=PT in a linear operating system and T rather than Y should be used in the equation.
The annual rate at which output grows (GDP) is determined by the operating system and the technology paradigm (organisation of human skills and capital to create a desired level of productivity.)
Where M=300, Velocity=2, P=US$25, Y=24 bn
If the economy is linear as it is with economies today then R=1 therefore growth does not benefit from the operating system’s accelerant . For example: .
PYR=25x24x1= US$600bn, Therefore, GDP is US$600 bn for the year
If the operating system is used to double growth over 1 year, that is, R=2
PYR= 25x24x2 = US$ 1,200 bn over the same period; therefore GDP has the potential to double to US$1,200 over the same period.
This accelerated growth takes place at constant price:
.i.e. P=KV(MS/E)/YR= 1,200/24×2=US$25
Accelerated growth is geometric allowing doubling to take place each consecutive year; significantly shortening the pace at which development occurs.
Hence, using the new Punabantu Equation of Exchange, as demonstrated in the equation above by the doubling of GDP from $600bn to $1,200 bn in one year, where the price level remains constant at $25, it is verified mathematically that an economy can finance the doubling of its GDP in one year at constant price. The new equation of exchange confers sovereign economic status on an economy as it allows a domestic currency to be minted and introduced into circulation where instead of generating inflation it acts as a stimulus for growth and development. It allows governments to grow their economies until productivity is on par with the needs of a given population.
[Note that doubling time (the rate of economic growth each year) does not have to be fully applied. It can be applied by percentage anywhere between 0% – 100%. The pace at which an economy can grow is determined by its technology paradigm.]
Split-Velocity Solutions, Outreach 1st February 2019
To begin with anyone familiar with central banking history will know that there was a time that central banks kept gold in their vaults to back the value of currency in circulation. However, the gold standard was inevitably discarded for the simple fact that the value of gold may itself fluctuate over time, furthermore a system like this restricts a central bank’s capacity to issue new notes and coins to the availability of gold and can be quite costly to manage especially when a government needs to apply monetary policy to manage growth in an economy.
The gold standard was abandoned for good reason. Instead of measuring the value of a local currency against gold, central banks today instead monitor natural fluctuations in economic growth and increase or reduce money supply. This controls inflation levels and maintains the stability of a local currency. But as can be observed in Zambia where in the past few years the value of the Kwacha has fallen from US$1 – ZMK8 to US$1-ZMK12. This system is not perfect. In fact, it doesn’t really work, simply due to the fact that the Zambian Kwacha, in this system, is indexed against the natural propensity for the economy to grow over a period of time. Consequently, any shocks to the economy, such as drought, electricity deficits, a drop in copper prices, fall in forex reserves will hammer the value of the Kwacha and BOZ will be forced to ride these trends. It will only be able to mitigate against them using monetary policy, which is why the Kwacha must inevitably lose value as a buffer against declining economic performance. Put simply this places BOZ at the mercy of trends in the economy since the value of the Kwacha in the current system is indexed against economic performance, in the same way that a fall in the international gold price would affect local currency were it on the gold standard. Furthermore, increases in money supply using monetary policy must be supported by economic growth. In other words before BOZ can increase money supply it must first observe an increase in productivity or output in the economy.
Why Split Velocity technology is more valuable than the Gold Standard and more efficient than conventional Monetary Policy
The Gold Standard limits the capacity to back a national currency to the volume of gold held in the vaults of a reserve bank, the price of gold and other economic factors. Monetary policy limits a government’s capacity to back its national currency to the economic performance which can be quite poor when growth in GDP is minimal as is common in today’s economies. A Split-Velocity model backs a government’s national currency with economic value equivalent to 100% of GDP. Neither the Gold Standard nor current Monetary Policy come anywhere near this kind of strength and stability. Consequently governments are better able to and have the resources at hand to withstand shocks to the economy and easily counter shocks that would push an economy into recession. Whether these shocks are caused by natural disasters such as floods, earthquakes or are technical such as shortages of electricity, unemployment and poverty that governments may have trouble resolving today a Split-Velocity model on the other hand will be able to thenceforth counter these kinds of economic shocks with relative ease giving central banks the tools they need to support government.
A Split-Velocity Model is the first system or technology that allows central banks to control economic outcomes. For instance, whereas the Gold Standard is limited by the value of gold and amounts of it held in reserve; and Monetary Policy is dictated to by natural trends in economic growth over time, a Split Velocity model is not as weak or redundant as any of these approaches. It does not wait for a “price level” to be set by economic trends such as a natural growth of 3% experienced by the economy in one year. A Split Velocity model can allow a central bank to stimulate growth at constant price anywhere between 0 to 100% of GDP in one year. In other words, the central bank does not wait to see how the economy will perform, it now dictates how fast it wants that economy to grow over a given time frame.
This is unique in that no other technology/system offers central banks this kind of power over an economy. Mediocre natural growth rates such as 3% or 6% are now thrown out the window as the central bank can now harness as much as 100% of an economy’s capacity to grow over time [due to ending inefficiencies causing losses as a result of subtraction or implosion in the circular flow of income]. Since the central bank now controls the growth rate, it is no longer at the mercy of economic indicators, it now dictates them and can raise or slow down economic growth at will. Consequently, it now has near perfect control of the value of the national currency. For the Bank of Zambia, this means that the Zambian government, for the first time in Zambia’s history, would have at its disposal enough financial resources to end poverty in Zambia in just a few years. This is why we have made a submission to the Bank of Zambia for the introduction of a Split-Velocity system in Zambia.
This makes a Split Velocity Model more valuable than a Gold Standard when it comes to managing a national economy. It also means a Split Velocity Model or system is far more powerful, efficient, effective and advanced than any aspect of Monetary Policy currently being used by the Bank of Zambia [or any central bank in the world today for that matter] to manage a national economy.